Research and development item: ③(a-1) Development of quantification methods for distributions of nanomaterials and biological responses
Implemented by the National Institute of Advanced Industrial Science and Technology
Final objective: With animals used as subjects in intratracheal administration testing and inhalation toxicity testing, we combine high-resolution observations of cells of lung tissue sections in the order of nanometer, with wide-field observations of the lung tissue in the order of millimeter, to establish a method of quantifying the distribution of nanomaterials and biological responses in the lung tissue. We compile and release the developed method as a technical instruction manual.
Main results:
When the biological activity is stopped by dissection, the fine structure of the biological tissue changes because of washout of proteins and lipids. For observation using transmission electron microscopy, which is capable of making observations on the order of nanometer, samples that retain the fine structure of the tissue must be prepared. However, for wide-field optical microscopy observations, the whole lung, a soft bag-like organ, must be sectioned. Because immunostaining is used to visualize biological response distribution, a method of preparing samples that does not deactivate antigen–antibody reaction is required. We developed an observation sample preparation protocol that satisfied the aforementioned requirements. We also developed a technique for observing the biodistribution of nanomaterials at the millimeter scale using optical microscopy and fluorescence X-ray microscopy and a technique for high-resolution analysis and observation of nanomaterials in cells at the nanometer scale using transmission electron microscopy. With regard to quantifying the distribution of biological responses owing to intake of nanomaterials, we also developed a millimeter-order, wide-field immunohistological analytical technique using a laser confocal microscope and a nanometer-order immunohistological analytical technique using a TEM.
(1) Quantification of biodistribution of nanomaterial in a body
Figure ③(a-1)-1(a) shows an optical microscope image of the lung tissue 3 days after intratracheal administration of TiO2 nanoparticles with rats, and Figure ③(a-1)-1(b) shows mapping the fluorescence X-ray intensity of Ti, where the fluorescence intensity was generated by irradiation of X-rays converged to 10 μm. The results in Figure ③(a-1)-1 show that TiO2 nanoparticles do not remain in the respiratory tract but invade the surrounding alveoli, and a large amount of TiO2 nanoparticles are present locally in the lung. Local observation and quantitative elemental mapping of nanomaterials in cellular structures with nanometer resolution using a TEM is now possible.
Figure ③(a-1)-2(a) shows a TEM image of the alveolar macrophage of a rat to which NiO nanoparticles were intratracheally administered. The figure shows that the fine cell structure is clearly maintained and black particles are present in the phagosome. Figure ③(a-1)-2(b) shows a Ni mapping image via electron-beam energy loss spectroscopy. Because the black particles coincide with the mapping image of Ni, the black particles in the alveolar macrophage are determined to be NiO.
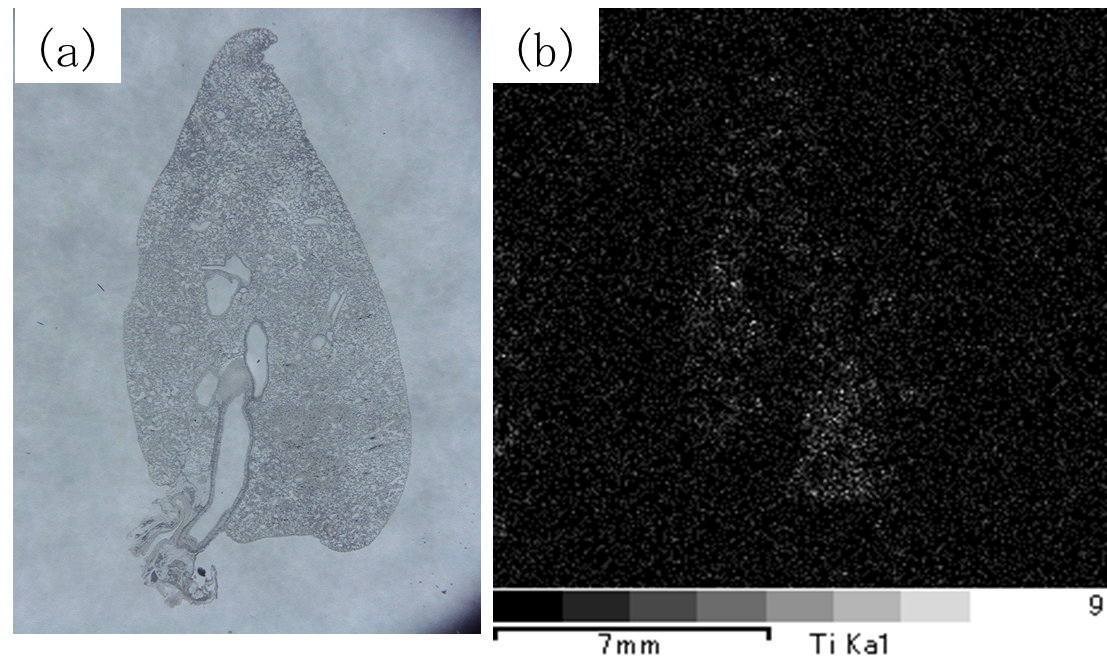
Figure③(a-1)-1 Optical microscope image of the lung tissue 3 days after intratracheal administration of TiO2 nanoparticles with rats (a)
and mapping the fluorescence X-ray intensity of Ti (b)
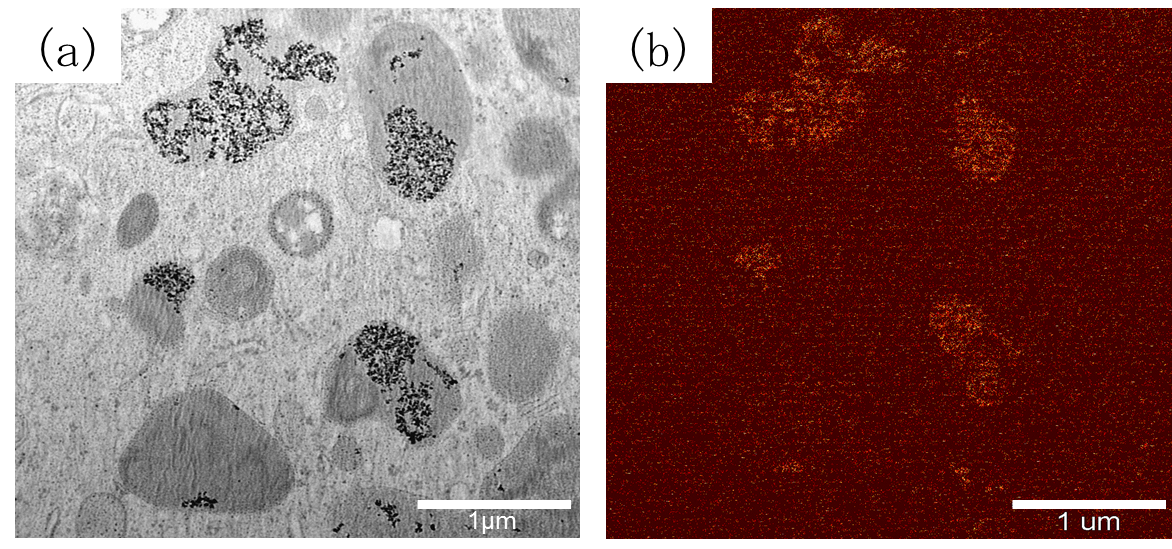
Figure③(a-1)-2 TEM image of the alveolar macrophage of a rat to which NiO nanoparticles were intratracheally administered (a)
and Ni mapping image via electron-beam energy loss spectroscopy (b)
(2) Quantification of the biological response distribution of nanomaterials
With respect to the biological response distribution of nanomaterials, we established immunohistological analytical techniques with submillimeter resolution using a laser confocal microscope and nanometer resolution using a TEM. From prior research related to correlation of the production of Toll-like receptor 4 (TLR4), one of the surface receptors of inflammatory M1 macrophage, with nanoparticle dose, we focused on TLR4 production as an indicator of the biological responses to nanomaterials.
Figures ③(a-1)-3(a) and ③(a-1)- (b) show phase contrast and fluorescence observation images, respectively, of the left lung of a rat at one month after inhalation exposure to NiO nanoparticles. Agreement of the alveolar macrophage in Figures 3(a) with the fluorescence emission points in Figures ③(a-1)-3(b) indicates that the alveolar macrophage produces TLR4 and emits fluorescence with fluorescein isothiocyanate markers.
Figure ③(a-1)-4(a) shows a TEM image of the alveolar macrophage of the left lung of a rat at 1 month after inhalation exposure of NiO nanoparticles. Figure ③(a-1)-4(b) shows an enlarged image of the area near the black agglomerated particles, and Figure 4(c) shows an enlarged image of the end of the alveolar macrophage. As indicated with an arrow in Figure ③(a-1)-4(b), phagocytosis of black NiO nanoparticles by the macrophage is observed. As indicated by the arrow in Figure ③(a-1)-4(c), gold colloid markers of a secondary antibody are observed at the end of the alveolar macrophage, which indicates TLR4 production. By counting the number of gold marker particles, we can evaluate the relative quantity of TLR4 produced.

Figures③(a-1)-3 Phase contrast (a) and fluorescence observation(b) images of the left lung of a rat at one month after inhalation exposure to NiO nanoparticles
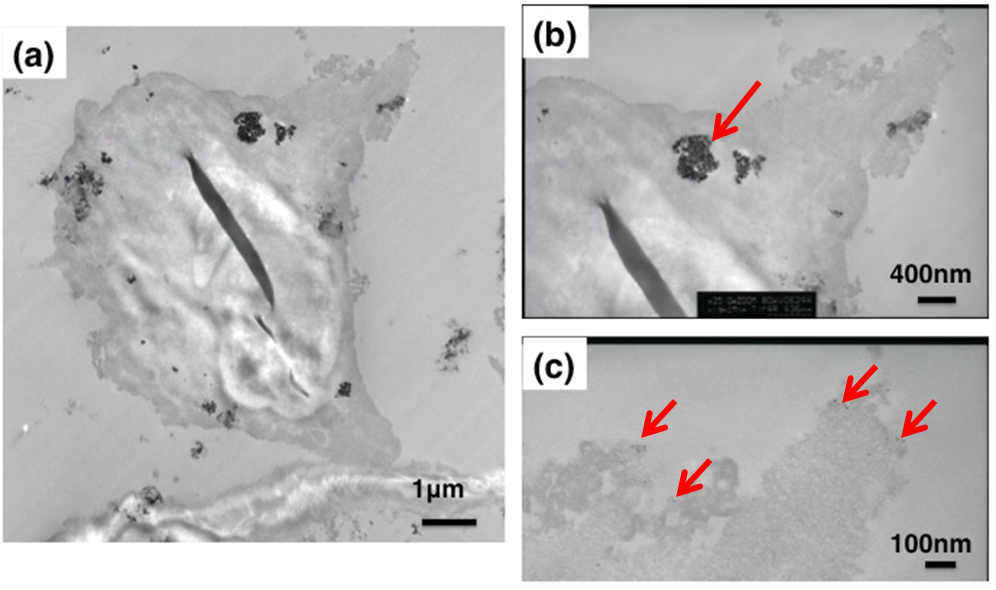
Figure③(a-1)-4 TEM image of the alveolar macrophage of the left lung of a rat at 1 month after inhalation exposure of NiO nanoparticles (a) and an enlarged image of the area near the black agglomerated particles (b), and an enlarged image of the end of the alveolar macrophage (c)